| Overall | 15W 6L 0T |
| District | 4W 0L 0T |
| Expected | 17: 1+ 3- |
":" = Games won or lost as expected,
"+" = Games won against stronger team,
"-" = Games lost against weaker team)
|
40 7 1 Rank in State, Class, District |
952 168 Strength Momentum |
752 46.7(41) SOS, RPI(RPI Rank) |
":" = Games won or lost as expected, "+" = Games won against stronger team, "-" = Games lost against weaker team) | |
| Date | Opponent1 | RGWF4 | Opp Strength | Result | Expectation2 | Playing Strength | P(Win)3 | Send |
|---|---|---|---|---|---|---|---|---|
| 08/18/15 | Socorro | 0.000 | 1158 | L 0- 9 | Expected (-7) | 580 | 30% |  |
| 08/22/15 | ATC | 0.000 | 442 | W 6- 0 | Expected (+1) | 989 | 93% | |
| 08/25/15 | at Monte del Sol ? | 0.000 | 752 | L 1- 2 | Worse (-3) | 814 | 70% | |
| 08/28/15 | at Silver | 0.000 | 759 | W 1- 0 | Expected (-1) | 917 | 68% | |
| 08/29/15 | at Bernalillo | 0.000 | 958 | W 1- 0 | Better (+1) | 1017 | 46% | |
| 08/29/15 | at Taos | 0.000 | 816 | L 1- 2 | Worse (-2) | 846 | 63% | |
| 09/01/15 | Sandia Prep | 0.001 | 1273 | L 1- 5 | Expected (-1) | 900 | 20% | |
| 09/05/15 | at Santa Fe Prep | 0.001 | 722 | W 4- 0 | Expected (+2) | 1050 | 72% | |
| 09/10/15 | Gallup | 0.003 | 581 | W 6- 1 | Expected (+1) | 1007 | 86% | |
| 09/15/15 | Robertson | 0.012 | 615 | W 2- 1 | Expected (-3) | 822 | 84% | |
| 09/17/15 | at Hatch | 0.010 | 665 | W 4- 0 | Expected (+1) | 1022 | 77% | |
| 09/24/15 | Ruidoso | 0.037 | 700 | W 5- 1 | Expected (+1) | 1016 | 78% | |
| 09/26/15 | at Robertson ?? | 0.062 | 615 | L 0- 1 | Worse (-4) | 746 | 81% | |
| 09/29/15 | Hatch | 0.059 | 665 | W 5- 0 | Expected (+2) | 1049 | 80% | |
| 10/06/15 | Bernalillo !! | 0.191 | 958 | W 2- 0 | Expected (+2) | 1044 | 52% | |
| 10/09/15 | at Portales | 0.227 | 760 | W 3- 1 | Expected (0) | 968 | 69% | |
| 10/13/15 | Bloomfield ! | 0.240 | 918 | W 5- 0 | Expected (+4) | 1176 | 57% | |
| 10/19/15 | Ruidoso | 0.497 | 700 | W 3- 0 | Expected (0) | 965 | 78% | |
| 10/21/15 | Rehoboth Christian | 0.608 | 739 | W 2- 0 | Expected (0) | 934 | 75% | |
| 10/24/15 | Portales | 0.703 | 760 | W 2- 0 | Expected (0) | 945 | 73% | |
| 10/31/15 | Kirtland Central | 0.870 | 1050 | L 1- 2 | Expected (0) | 940 | 41% | |
|
Notes: 1Games against an opponent in the same district are shown in bold letters; may NOT be an actual district game Numbers in parentheses for reported games are the goals East Mountain actually scored, relative to what ratings predicted 2Numbers listed for unreported/future games are the most probable winning margin 3P(Win) is the expected winning Percentage -- the statistical success rate for predicting the game winner between teams of this strength difference 4RGWF is the relative weight factor for this game * Game at a neutral site, or unable to determine which team gets home field advantage |
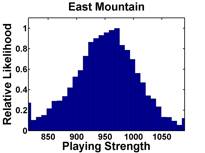
The median opponent strength is 752, while
East Mountain's "weighted playing strength" is 966
(where a win by 4 goals counts 0.69 as much as a 1 goal win, and
a game played on 10/17/15 counts 0.5 that of one played on 11/07/15)
Go back to ratings for Boys Varsity Girls Varsity Main Page